How to Check Node CPU Utilization in OpenShift – Complete 2025 Guide!
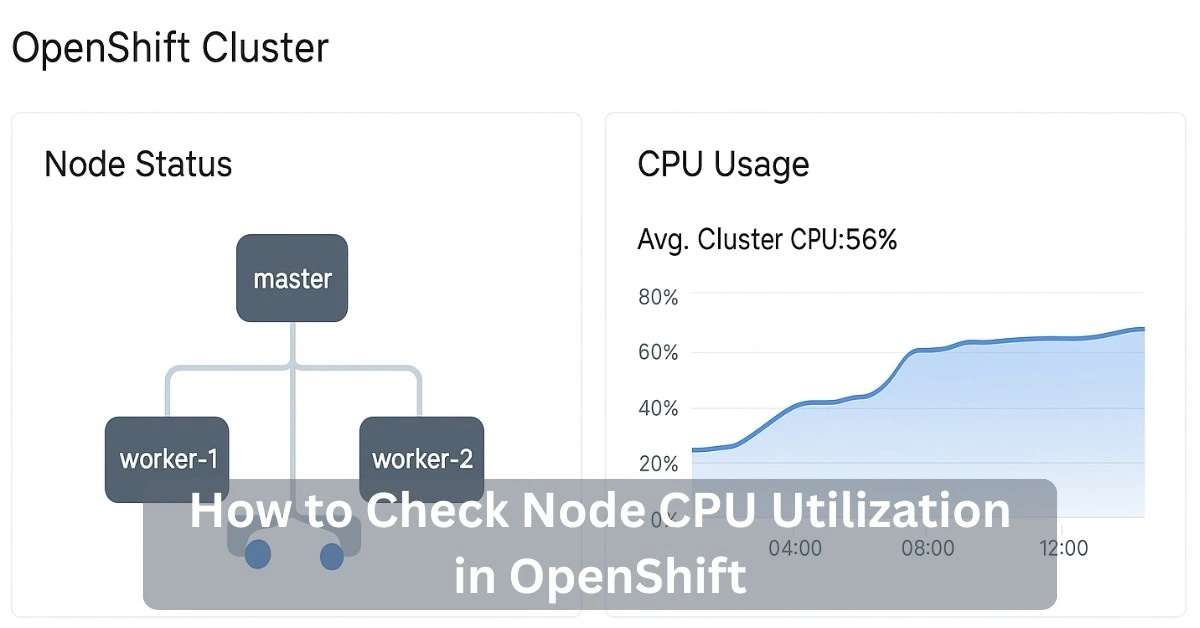
Monitoring node CPU utilization in OpenShift helps you keep your cluster fast and healthy. When a node’s CPU gets too high, pods slow down and apps become unstable. By checking CPU usage regularly through the CLI, dashboard, or metrics tools, you can detect problems early and maintain smooth performance.
This guide explains simple and practical ways on how to check node CPU utilization in OpenShift, even if you are still learning the platform.
What Does Node CPU Utilization Mean in OpenShift?
Node CPU utilization shows how much of the node’s processing power is being used at any moment. Each node has a fixed amount of CPU, and OpenShift measures how much of it is used by:
- pods
- system processes
- kubelet
- CRI-O
- background services
If the CPU stays high for a long time, the node can slow down or become unstable. If the CPU stays at a normal level, the cluster keeps running smoothly.
In OpenShift, CPU is shown as cores, millicores (m), and percentages. These values come from the kubelet, cgroups, and Prometheus metrics.
Also Read: How Much CPU Usage is Normal? – Optimize CPU 2025
How Do You See CPU Usage With oc adm top?
The easiest way to check CPU usage in OpenShift is by using the CLI. To see a live snapshot of all nodes, run:
oc adm top nodes
This command shows CPU usage in cores, CPU percentage, memory usage, and the total node capacity in one place. If you notice CPU staying above 80%, it usually means the node needs scaling or further investigation.
For checking which pods are using the most CPU, use:
oc adm top pods --all-namespaces
This helps you quickly find the heaviest CPU consumers in your cluster.
How to View Node CPU Capacity and Allocatable CPU?
Every node has two key CPU values:
- Capacity: total number of CPU cores on the node
- Allocatable: CPU left for workloads after the system takes its share
To check these values, run:
oc describe node <node-name>
Then scroll to the Capacity and Allocatable sections.
If the allocatable CPU gets too low, new pods may fail to schedule and can stay in a Pending state.
How to Check CPU Requests and Limits Per Node?
CPU requests and limits control how much CPU a pod reserves and how much it’s allowed to use. If requests are set too high, a node can look full even when real usage is low.
To check pod CPU usage:
oc adm top pods --all-namespaces
To see allocatable CPU for all nodes:
oc get nodes -o jsonpath='{.items[*].status.allocatable.cpu}'
These values help you see how much CPU is reserved, how much is free, and whether nodes are being over-requested.
Why Do CPU Numbers Differ in Top and Prometheus?
You may notice different CPU numbers in the CLI and Prometheus. This is normal because:
- Prometheus scrapes data every 15–30 seconds
- CLI shows real-time usage
- cgroup throttling impacts Prometheus
- Prometheus uses cumulative counters
- CLI rounds CPU differently
Both tools are correct, but they measure differently. Use:
- CLI for quick, real-time checks
- Prometheus for long-term trends
How to Query Node CPU Usage With Prometheus?

Prometheus gathers CPU data from each node using metrics like node_cpu_seconds_total, which tracks how much time the CPU spends in different states, such as idle, user, or system.
To measure real CPU usage, Prometheus calculates how much time the CPU spent not being idle.
A common PromQL query for node CPU utilization is:
100 - (avg by (instance) (rate(node_cpu_seconds_total{mode="idle"}[5m])) * 100)
This shows the CPU usage of each node over the past 5 minutes.
For more detailed explanations of Prometheus metrics, you can check the official documentation:
https://prometheus.io/docs/introduction/overview/
Also Read: How to Check CPU Power Consumption? – Complete Guide 2025
What PromQL Metric Shows Node CPU Utilization?
Prometheus uses the node_cpu_seconds_total metric to measure how much time a CPU spends in different states like user, system, idle, irq, and softirq. To calculate node CPU utilization, Prometheus focuses on the non-idle values.
Other helpful CPU-related metrics include:
container_cpu_usage_seconds_totalnode_load1,node_load5,node_load15pod_cpu_usage
These metrics give a deeper view of how busy a node is and how workloads are using CPU over time.
How to Use Grafana to Track CPU Over Time?
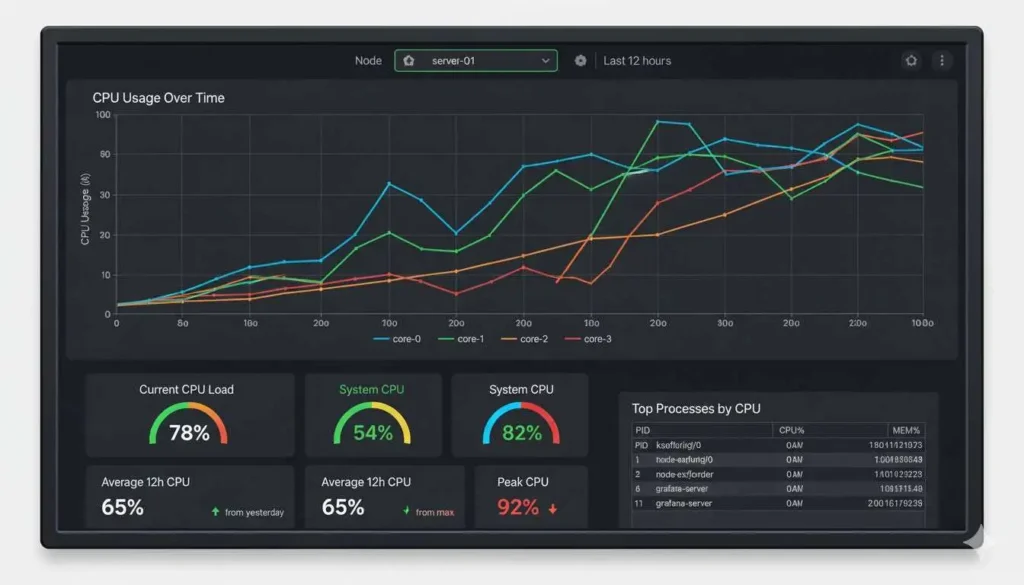
Grafana provides graphs that make CPU usage easy to understand. To open built-in dashboards:
- Open the OpenShift Console
- Go to Observe
- Click Dashboards
- Select Node Metrics or Compute Resources
Grafana helps you:
- View CPU usage trends
- compare nodes
- Find peak times
- detect performance problems
Custom dashboards can be created for deeper monitoring and alerting.
When Is System Reserved CPU Usage Too High?
System-reserved CPU includes usage from kubelet, CRI-O, and operating system processes. When these values increase too much, application pods slow down even if their own CPU usage is low.
Common signs of high system-reserved CPU:
- kubelet above 50%
- CRI-O above 50%
- system services above 80%
These issues often come from:
- too many container restarts
- high logging load
- image pulls
- misconfigured limits
How to Find CRI O or Kubelet CPU Issues?
You can use Prometheus queries to see CRI-O or kubelet CPU load.
Kubelet CPU: sum(rate(process_cpu_seconds_total{job=”kubelet”}[5m]))
CRI-O CPU: sum(rate(process_cpu_seconds_total{job=”crio”}[5m]))
If the numbers stay high, the node may become slow or unresponsive. Moving workloads or restarting services can help.
How to Set Alerts for High Node CPU Usage?
To monitor CPU problems automatically, OpenShift uses Prometheus to check CPU metrics and Alertmanager to send notifications when something goes wrong.
You can create an alert that triggers whenever a node’s CPU becomes too high or when the node stops reporting a healthy status.
A simple Prometheus rule for high CPU looks like this:
node_cpu_utilization > 0.85
And you can also check if the node is not ready:
kube_node_status_condition{condition="Ready", status!="true"}
Once these alerts fire, Alertmanager can send notifications to:
- Slack
- Webhooks (like Teams, custom apps, monitoring tools)
Setting up these alerts ensures that you know about CPU issues early, so you can take action before pods fail, nodes slow down, or users experience performance problems.
How to Export Node CPU Data for Reports?
CPU usage data can be exported for audits, reports, and capacity planning. You can download data from Prometheus using:
- CSV
- JSON
- API queries
Example:
curl -s http://prometheus/api/v1/query?query=node_cpu_seconds_total
This data helps track cluster growth and supports planning for new nodes.
How to Lower High CPU Usage on OpenShift Nodes?
If a node shows high CPU usage, you can try:
- moving pods to another node
- Adding more nodes
- lowering CPU limits
- fixing pods stuck in loops
- reducing logging
- Restarting kubelet or CRI-O
- removing unused applications
Balancing workloads usually brings the CPU back to safe levels.
Also Read: How to Reduce CPU Usage While Gaming? – Optimize Gaming 2025
Ways to Check Node CPU Usage in OpenShift:
| Method | Best For | Speed | Skill Level |
| oc adm top nodes | Quick checks | Fast | Easy |
| Prometheus | Deep analysis | Medium | Medium |
| Grafana | Trends and graphs | Medium | Easy |
| Node Exporter | System metrics | Fast | Medium |
How Node CPU Metrics Flow in OpenShift?
OpenShift collects CPU data from each node using the Kubelet and Node Exporter. Prometheus then reads this data and saves it. Grafana uses those saved metrics to show charts and graphs. If the CPU stays too high, Alertmanager sends a warning so you can fix the issue on time.
FAQs:
1. How do I check node CPU usage from the OpenShift console?
Go to Observe, then Dashboards and Node Metrics.
2. What is a normal CPU usage for a node?
Under 70% is healthy. Above 85% needs attention.
3. Why is Prometheus CPU usage different from oc adm?
Prometheus uses timed scrapes, and the CLI shows real-time values.
4. How do I know if a node is overloaded?
High CPU, slow pods, throttling, and scheduling delays.
5. Can a high kubelet CPU cause issues?
Yes. It can cause pod failures and slow scheduling.
Conclusion:
Checking node CPU utilization in OpenShift helps maintain strong performance and reliability. By using tools like oc adm top, Prometheus, and Grafana, you can easily monitor real-time and long-term CPU behavior. Regular monitoring makes it easier to detect problems early and keep your cluster running smoothly.

