How to Check GPU Health – Simple & Expert Guide (2025)
Knowing how to check GPU health is more important than ever in 2025. With demanding games, AI workloads, and ray tracing pushing graphics cards to their limits, a failing GPU can cause crashes, poor performance, or permanent damage.
This complete guide explains everything step-by-step, from basic built-in Windows tools to professional stress testing, so you can easily monitor GPU health, prevent overheating issues, avoid sudden crashes, and keep your graphics card running smoothly for years.
Why Checking Your GPU Health Matters in 2025:
Graphics cards today work much harder than older generations. Running games like Cyberpunk 2077 with path tracing, editing 4K videos, or using AI processing loads the GPU heavily. Over time, dust build-up, poor cooling, outdated drivers, or damaged VRAM can lead to serious problems.
Many people end up losing expensive GPUs simply because they didn’t check their health regularly. By monitoring your GPU health, temperatures, and performance early, you can:
- Prevent overheating
- Avoid system crashes
- Increase GPU lifespan
- Maintain stable performance
A few regular checkups can easily add extra years to your GPU’s life.
Signs Your GPU Is Unhealthy:

If your GPU is not in good health, you will likely notice:
- Frequent game crashes
- Random system freezes
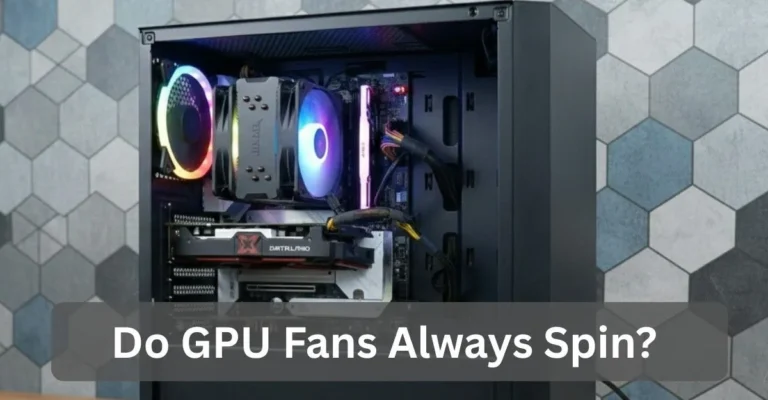
- GPU fans are running all the time loudly
- Visual glitches or artifacts
- Sudden FPS drops
- Black screen or no display
- Overheating even during normal use
If you experience multiple symptoms, start testing immediately.
How to Check GPU Health in Windows?
The best part? You don’t need to download anything to get a solid baseline check.
Task Manager Method:
- Press Ctrl + Shift + Esc
- Go to the Performance tab
- Click GPU
You will see:
- GPU usage
- Temperature (on supported GPUs)
- VRAM usage
- Clock speeds
- Performance in real time
This gives a quick and clear overview of your GPU health.
Device Manager Check:
- Right-click the Start button
- Select Device Manager
- Expand Display Adapters
If there is no yellow warning icon, it’s a good sign.
Double-click your GPU and check the Properties, look for “This device is working properly.”
DXDiag Tool:
- Search dxdiag
- Open it
- Go to the Display tab
This shows GPU information and automatically detects major issues.
These built-in checks already give you a strong health overview without installing anything.
Best Tools to Check GPU Health:
If you want deeper monitoring and professional-level details, these tools are highly recommended.
HWInfo:
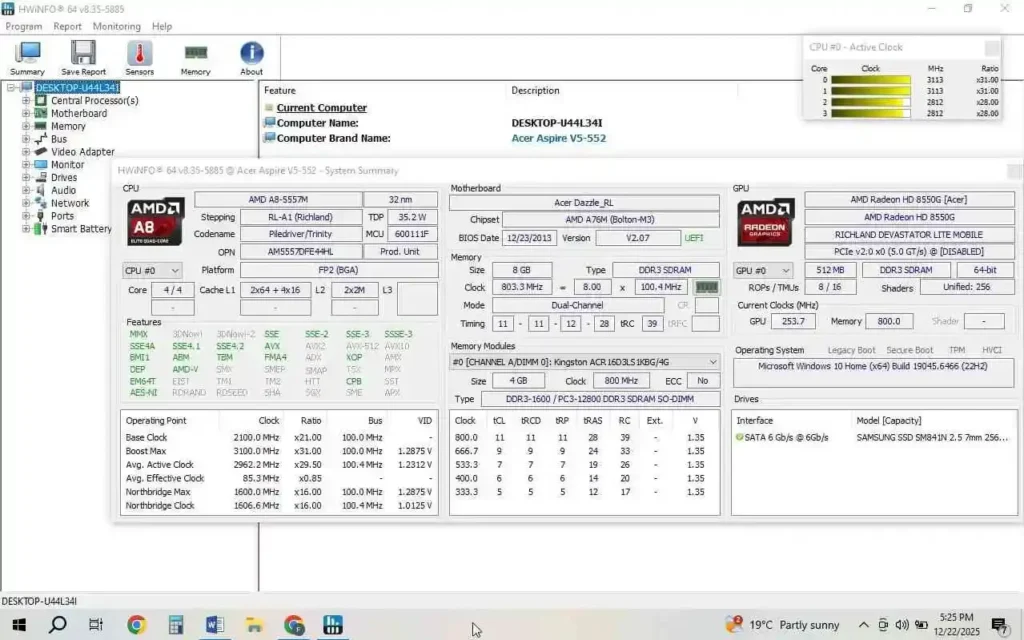
Perfect for deep diagnostics.
It shows:
- Detailed temperature sensors
- Power draw readings
- Hotspot temperatures
- VRAM health indicators
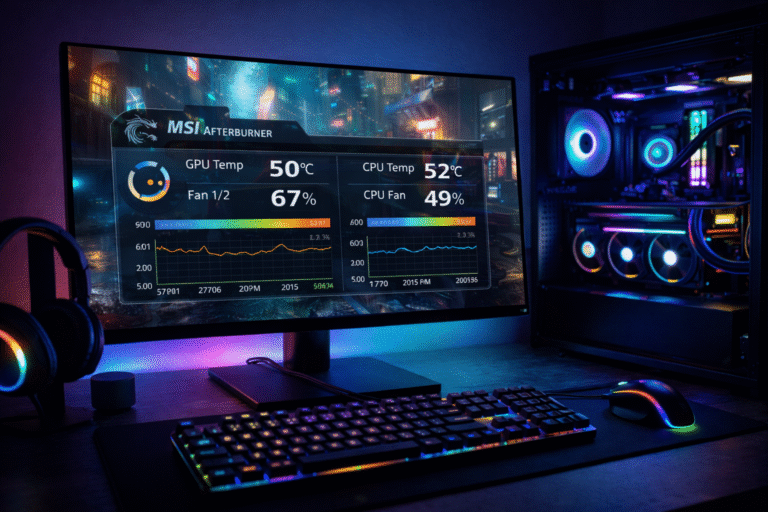
MSI Afterburner:
Most popular GPU monitoring tool.
You can:
- Track temperatures
- Monitor GPU load
- Check clock speeds
- View FPS overlay while gaming
- Log performance data
GPU-Z:
A lightweight and extremely useful tool:
- Shows GPU specs
- Real-time monitoring
- Voltage and clock analysis
Great for spotting throttling or voltage issues.
What Is a Good GPU Temperature?
Temperature is one of the most important factors in GPU health.
Safe GPU Temperature Range:
- Idle: 30°C – 40°C
- Gaming / Load: 60°C – 85°C
- Above 90°C = Dangerous Zone
If your GPU overheats, you may experience:
- Lag or stuttering
- Sudden crashes or shutdowns
- Reduced lifespan
- Hardware failure risk
Keeping temperatures under control is critical.
Also Read: Is 50°C Safe for CPU at Idle? – Expert Guide 2025!
How to Run Basic Benchmark Tests:
Benchmarks help you compare your GPU performance with expected performance.
Using 3DMark:
Fire up Time Spy or Fire Strike and run a few loops. Then check online scores for your exact GPU model if you are 20% or more below average, dig deeper.
Unigine Heaven / Superposition:
Both are free and excellent for stress testing.
- Run in loop mode
- Watch temperature and stability
- Look for major score drops
If performance keeps falling, it may indicate GPU health issues.
How to Stress Test GPU Health?
Stress tests push your GPU to its maximum limits to reveal hidden problems.
FurMark 2 (Maximum Heat & Power Test):

Best for: Detecting overheating, thermal throttling, and fan issues
- Download and launch FurMark 2
- Select your resolution and enable stress mode
- Run the test for 15–30 minutes
- Closely monitor temperature and GPU usage
What you should see:
- Temps stabilizing between 70°C – 85°C = Healthy
- Temps exceeding 90°C or instant shutdown = Cooling problem
Stop immediately if:
- GPU hits 90°C+
- Artifacts appear
- System crashes or freezes
MSI Afterburner + RTSS (Real-World Gaming Stress):
Best for: Real-time monitoring while gaming or benchmarking
This combo lets you stress test while actually playing games or running benchmarks.
You can:
- Monitor temperature
- Track GPU usage
- Check clock speeds and voltage
- View FPS in real time
Run a demanding game or benchmark for 30–60 minutes.
If temperatures stay stable and performance remains smooth, your GPU is likely healthy.
AIDA64 Stability Test (Full System Stability):
Best for: Deep stability + system-wide stress testing
AIDA64 doesn’t just test your GPU. It checks:
- GPU load stability
- Power draw behavior
- Combined CPU + GPU stress (great for weak PSUs)
Run for 20–30 minutes and monitor temperatures and stability.
Also Read: How to Check Motherboard Damage From GPU (Signs & Fixes)
How to Fix GPU Health Problems:
If your GPU is unhealthy, follow these solutions.
1. Clean Your GPU
- Remove dust from GPU fans
- Clean case airflow
- Use compressed air safely
- Ensure ventilation is clear
2. Update GPU Drivers
Use official software:
- Nvidia: GeForce Experience
- AMD: Radeon Adrenalin
- Intel: Arc Control
Driver updates often fix:
- Crashes
- Performance issues
- Compatibility errors
3. Improve Cooling
- Improve case airflow
- Add extra fans if needed
- Replace thermal paste (advanced users)
- Avoid blocking air vents
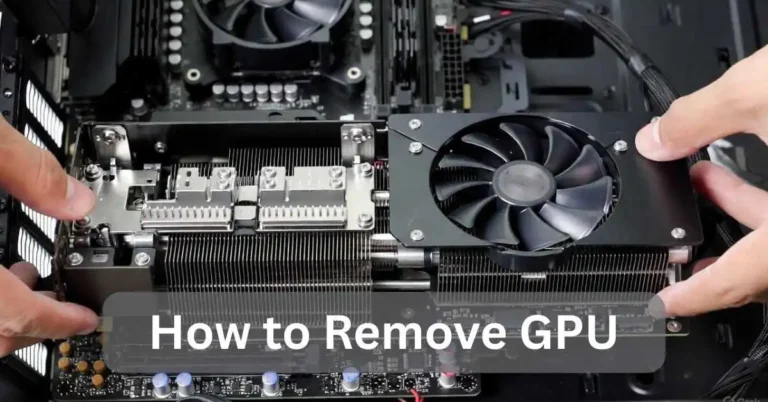
Also Read: How to Remove GPU – Step-by-Step Guide 2025
How to Check GPU VRAM Health?
VRAM damage is very common, especially on used or ex-mining GPUs.
OCCT has a dedicated VRAM test that works great. For older NVIDIA cards, MemTestG80 is still useful. Run it for at least 30 minutes any errors mean trouble.
I have seen mining-damaged cards fail VRAM tests first, even if they look fine otherwise.
Laptop vs Desktop GPU Health Checks: Key Differences:
Laptop GPUs:
- Naturally run hotter
- 85°C – 90°C under load can be normal
- Avoid extreme stress tests
Instead, monitor temps while gaming.
Desktop GPUs:
- Better airflow
- Easier to clean
- Safe for full stress testing
Physical Inspection and Cleaning for Better Health:
Software can’t show everything. Physical inspection is also important.
Check for:
- Dust buildup
- Damaged capacitors
- Loose power cables
- Dry thermal paste
Cleaning and repasting every 2–3 years greatly improves lifespan.
Common Mistakes When Checking GPU Health:
Avoid these mistakes:
- Only checking idle temps
- Ignoring driver updates
- Stress testing without temperature monitoring
- Testing only once instead of multiple times
Expert Tips for Long-Term GPU Maintenance:
To keep your GPU healthy:
- Keep drivers updated
- Maintain airflow
- Clean regularly
- Consider undervolting
- Avoid extreme overclocking
- Tested used GPUs thoroughly
Tool Comparison Table:
| Tool | Type | Key Features | Best For | Free |
| Task Manager | Built-in | Temp & usage | Quick check | Yes |
| DxDiag | Built-in | Diagnostics | Detecting issues | Yes |
| GPU-Z | Monitoring | Sensors & stats | Real-time info | Yes |
| FurMark | Stress | Extreme load | Stability check | Yes |
| OCCT | Stress + Errors | VRAM & power | Deep testing | Yes |
| MSI Afterburner | Monitor/OC | Overlay + logs | Gaming | Yes |
| 3DMark | Benchmark | Score comparison | Performance testing | Basic Yes |
FAQs:
1. What is the best way to check GPU health?
Just monitor temps, usage and stability using MSI Afterburner, GPU-Z, HWMonitor or Task Manager.
2. What is a safe GPU temperature in 2025?
Anything around 30°C–50°C idle and 60°C–85°C during gaming is fine, but staying near 90°C is not.
3. How do I know if my GPU is failing?
If you notice artifacts, crashes, overheating, FPS drops or black screens your GPU may be in trouble.
4. Can overheating damage a GPU?
Yes, running hot for too long can cause throttling, VRAM damage, and even kill the GPU.
5. Can I check GPU health without downloading software?
Yes, just use Task Manager, Device Manager, or DXDiag to check performance and basic health.
6. How to stress test GPU health safely?
Run FurMark, OCCT, or AIDA64 for 15–60 minutes and stop if temps hit 90°C or glitches appear.
Conclusion:
Checking GPU health is essential to keep your PC stable, fast and reliable. Regular monitoring, proper cooling, updated drivers, and maintenance will ensure your GPU performs smoothly and lasts longer.